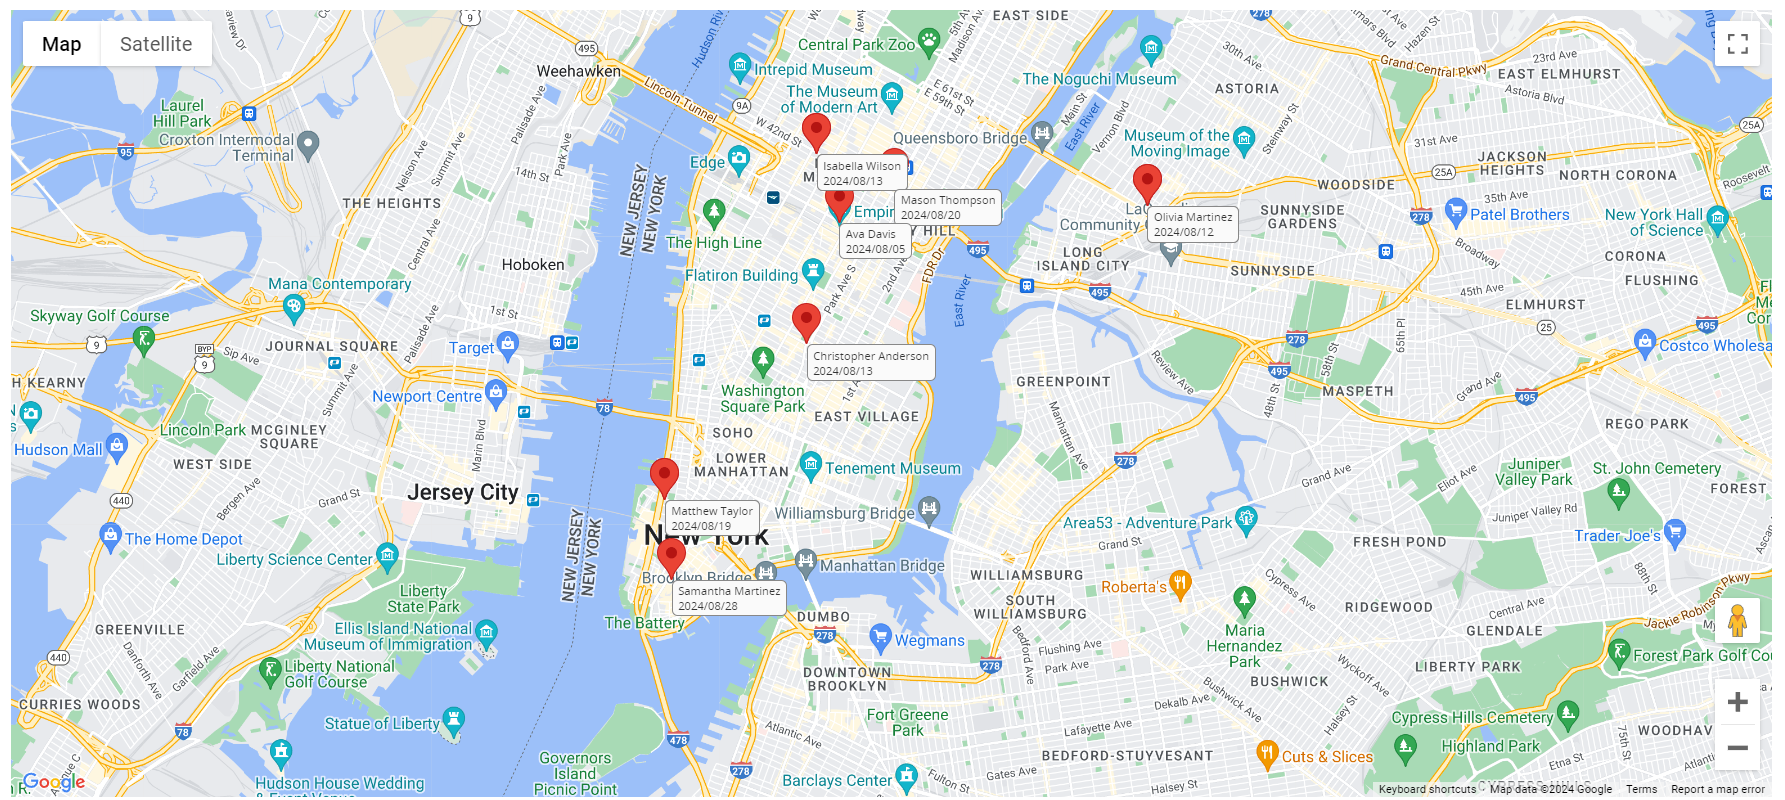
You can use Address Mapping to mark the Address field values from your records on Google Maps, helping you visualize the location distribution of your data. For example, you can view the distribution of branch locations, organize delivery addresses for orders, or see the distribution of baseball stadiums, etc.
Note: Your sheet must contain an Address field to generate the report.
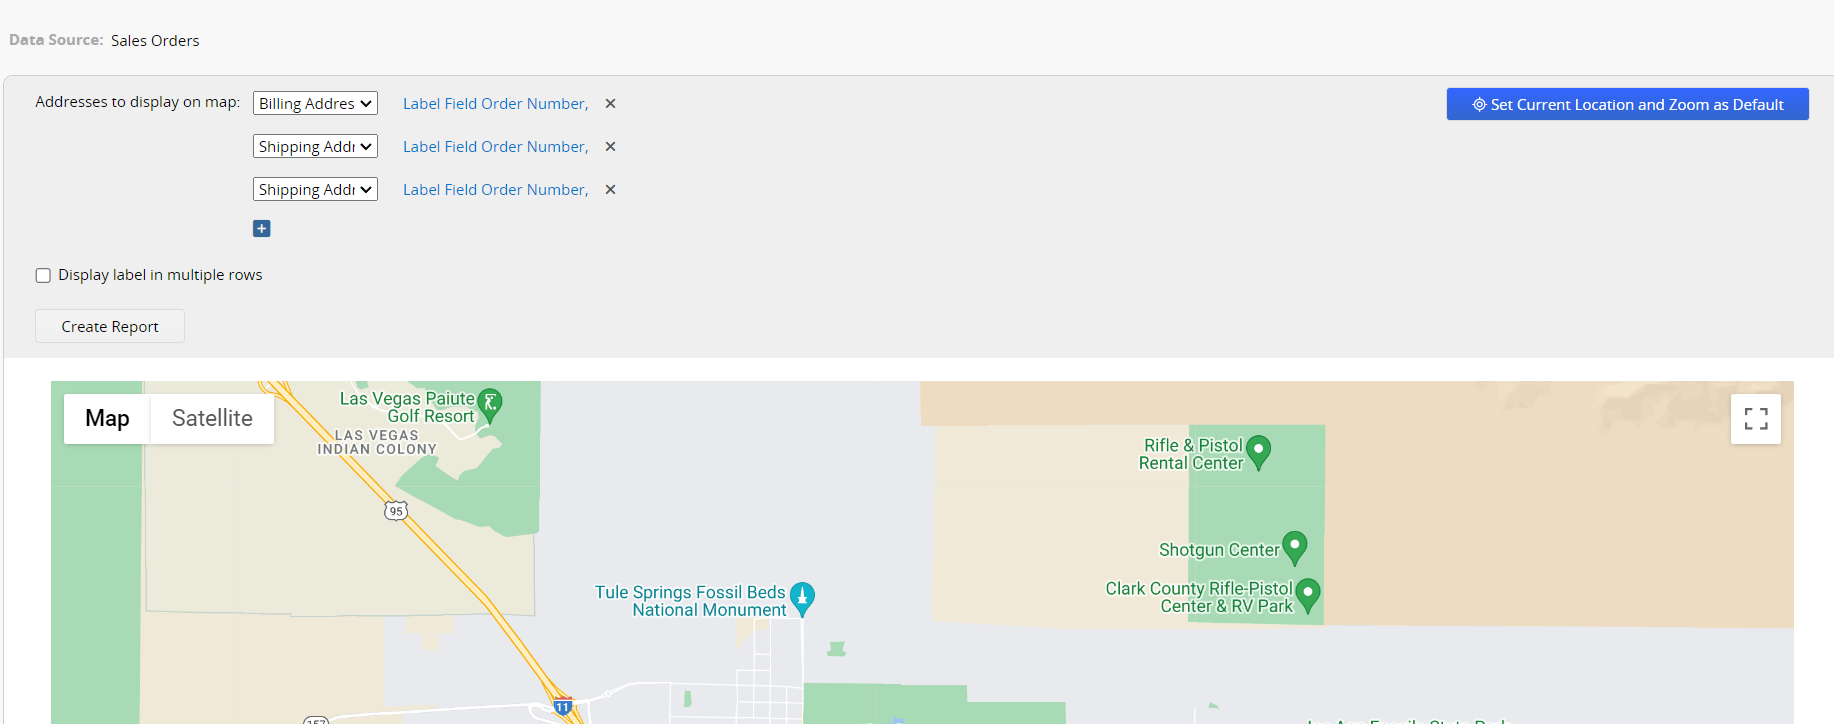
After creating the Address Mapping report, the following page will appear.
The settings for the Address Mapping are explained below:
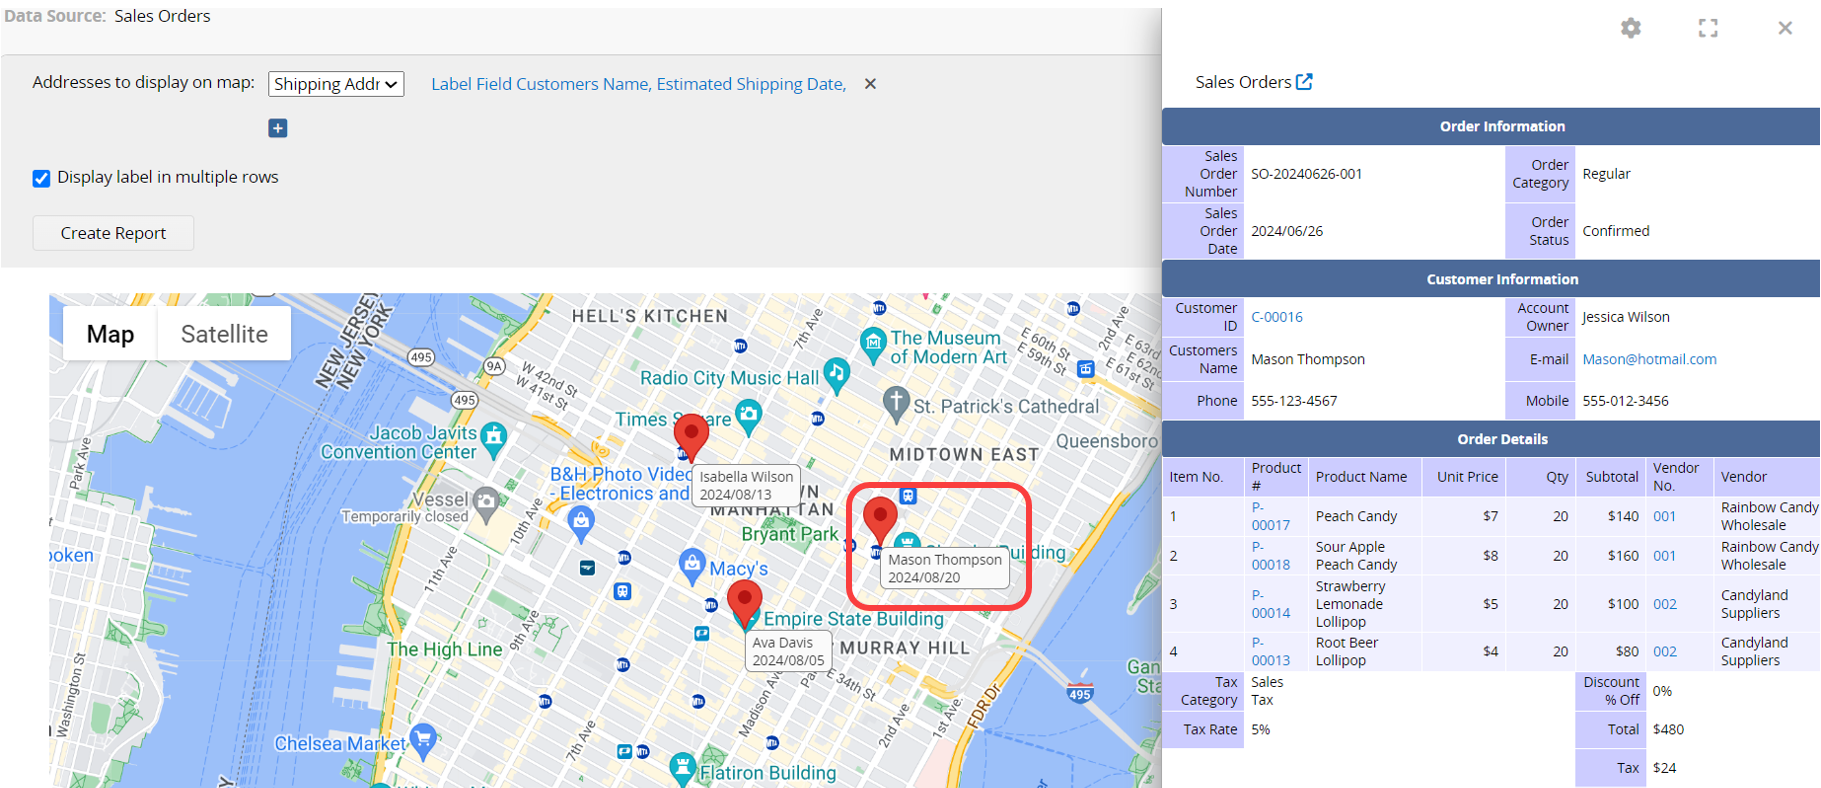
When creating the report, the top section will display all Address fields from the sheet. You can click the x next to any field to remove it. To add fields, simply click the + below.
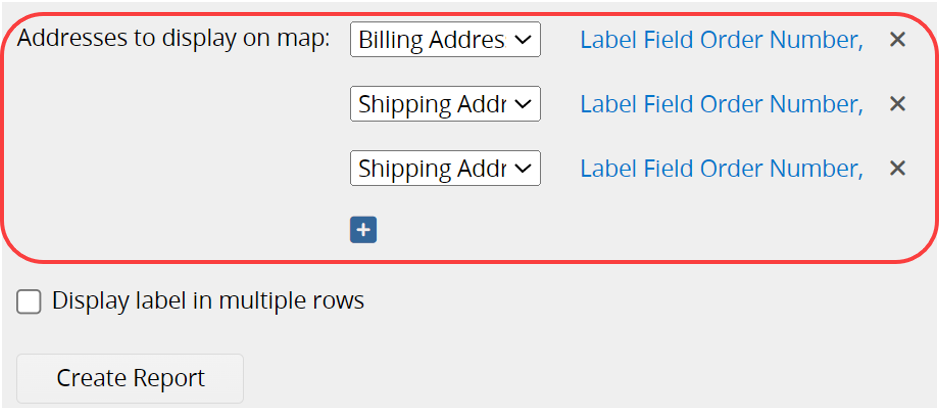
You can select which field values to display on the map and adjust their display order.
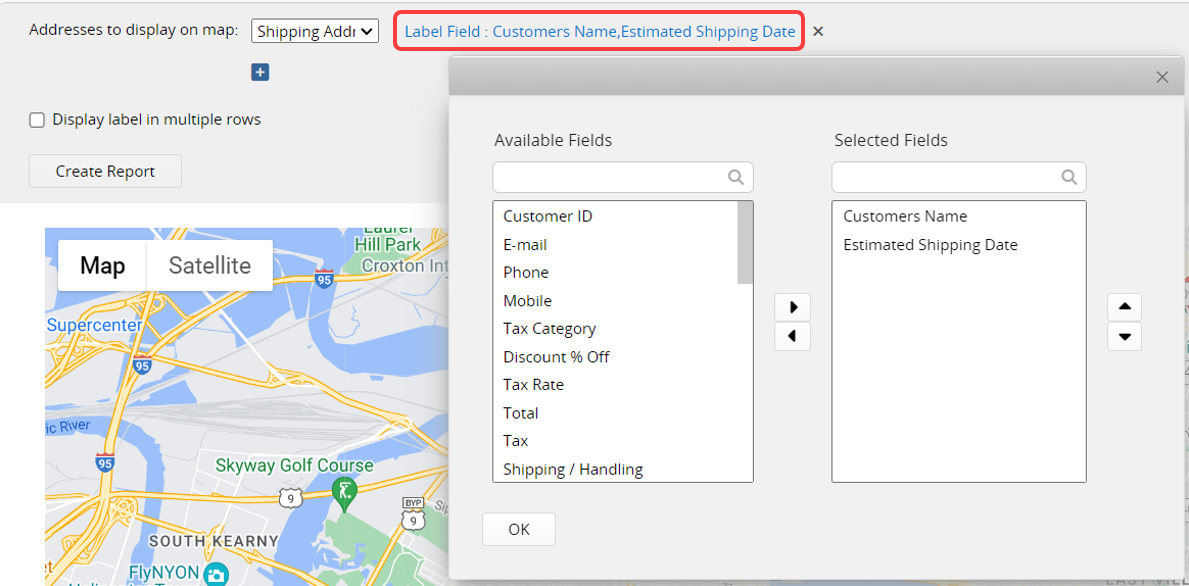
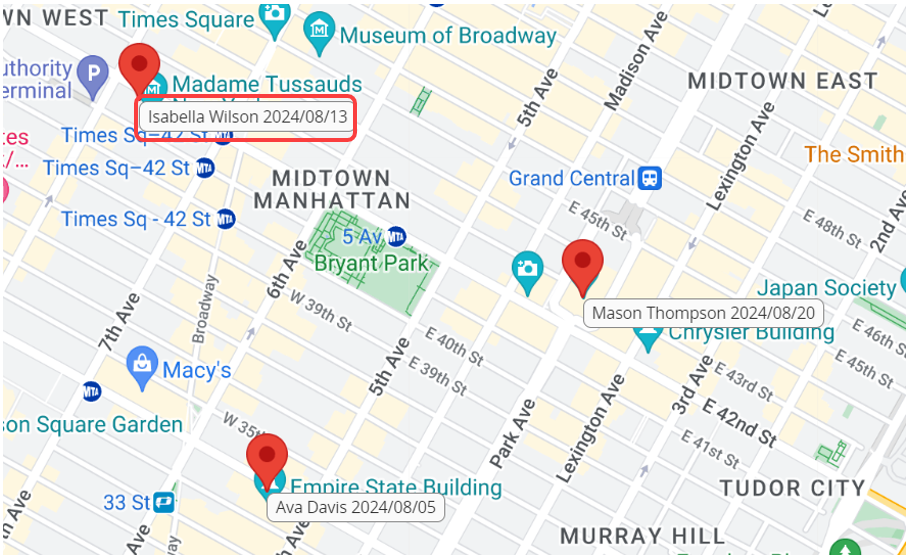
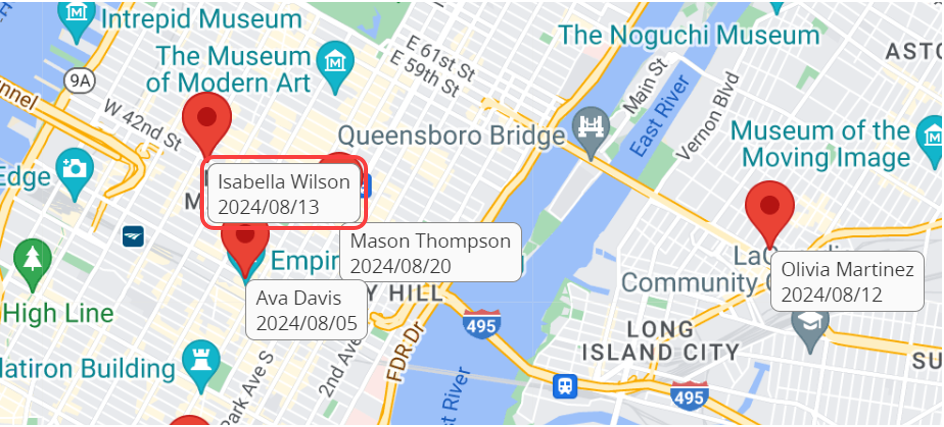
The labels on the map will show the values of the fields you have chosen.
You can also check the Display label in multiple rows, which changes the label layout from horizontal to vertical.
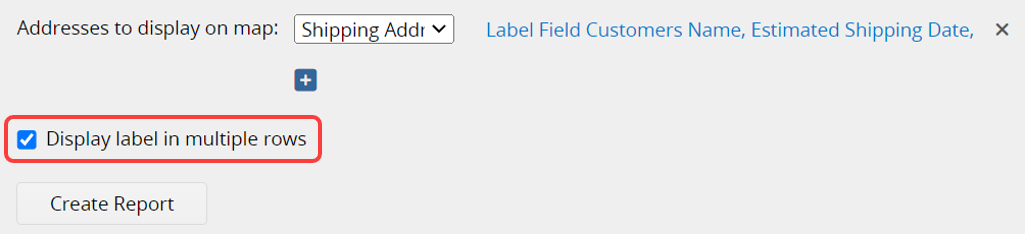
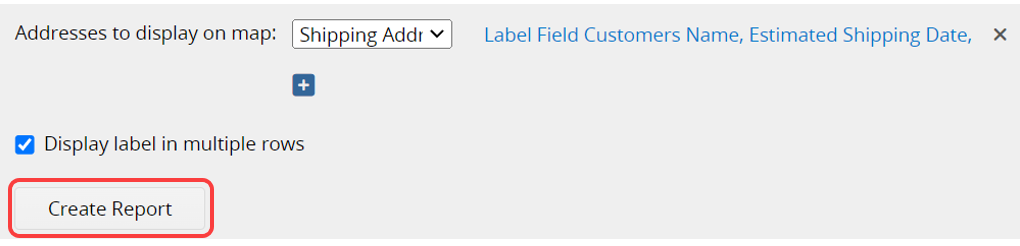
After each adjustment to the settings, you need to click Create Report again to update the report.
When you click on a label on the map, detailed information for that record will be displayed on the right side.
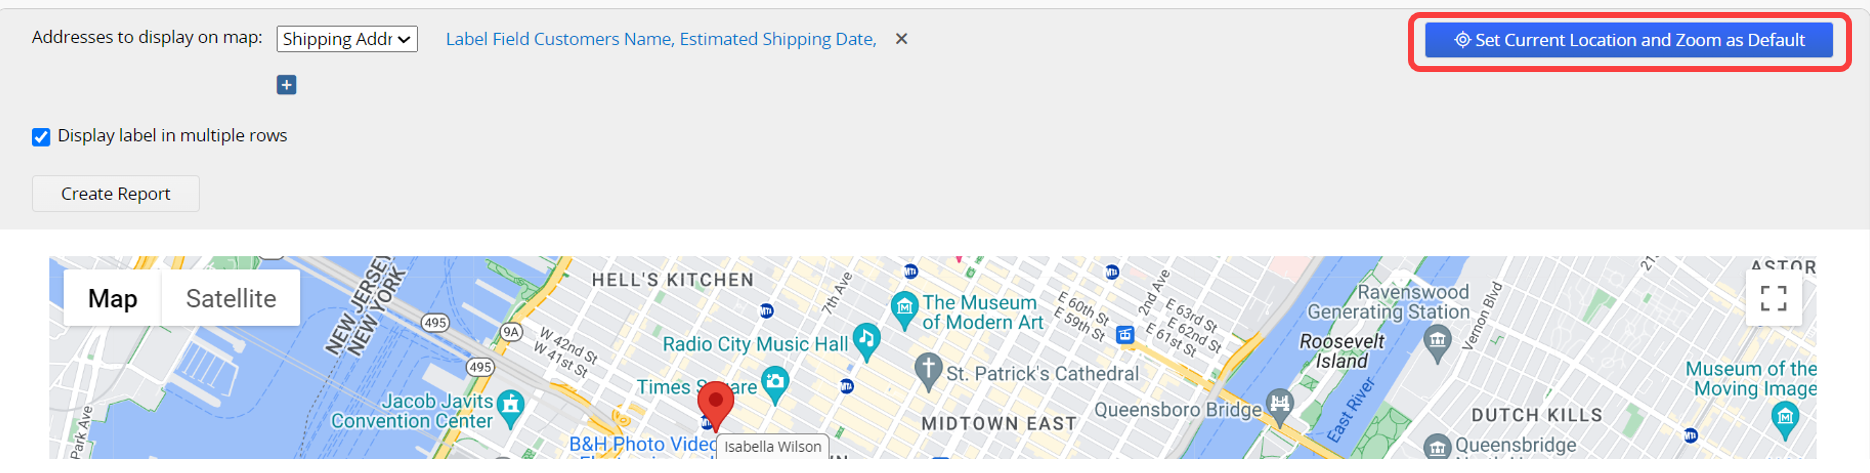
If you want to display a specific zoom level and location each time you access the report, click Set Current Location and Zoom as Default in the upper right corner.
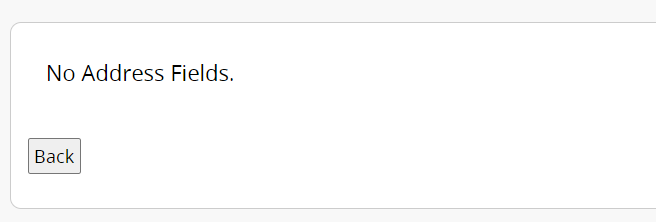
When there are no Address fields in the sheet, the following message will appear when creating the report.
Note: Since the report is linked to Google Maps, only a limited number of addresses can be displayed per second. If you have more than 10 addresses, only one address will be added per second. Therefore, with a large amount of data, it will take more time to display all addresses. Applying filters to reduce the number of displayed addresses can help shorten the display time.
If you frequently use this type of report, you can save it for easy access later. Additionally, you can export the report as a PDF file or print it.
You can apply filters to generate the desired report.
You can embed the report into your website or share a link with others.
In the Report Settings, you can adjust the report’s style settings, including font, font size, borders, etc., and the report’s Filter and Access Rights.
 Thank you for your valuable feedback!
