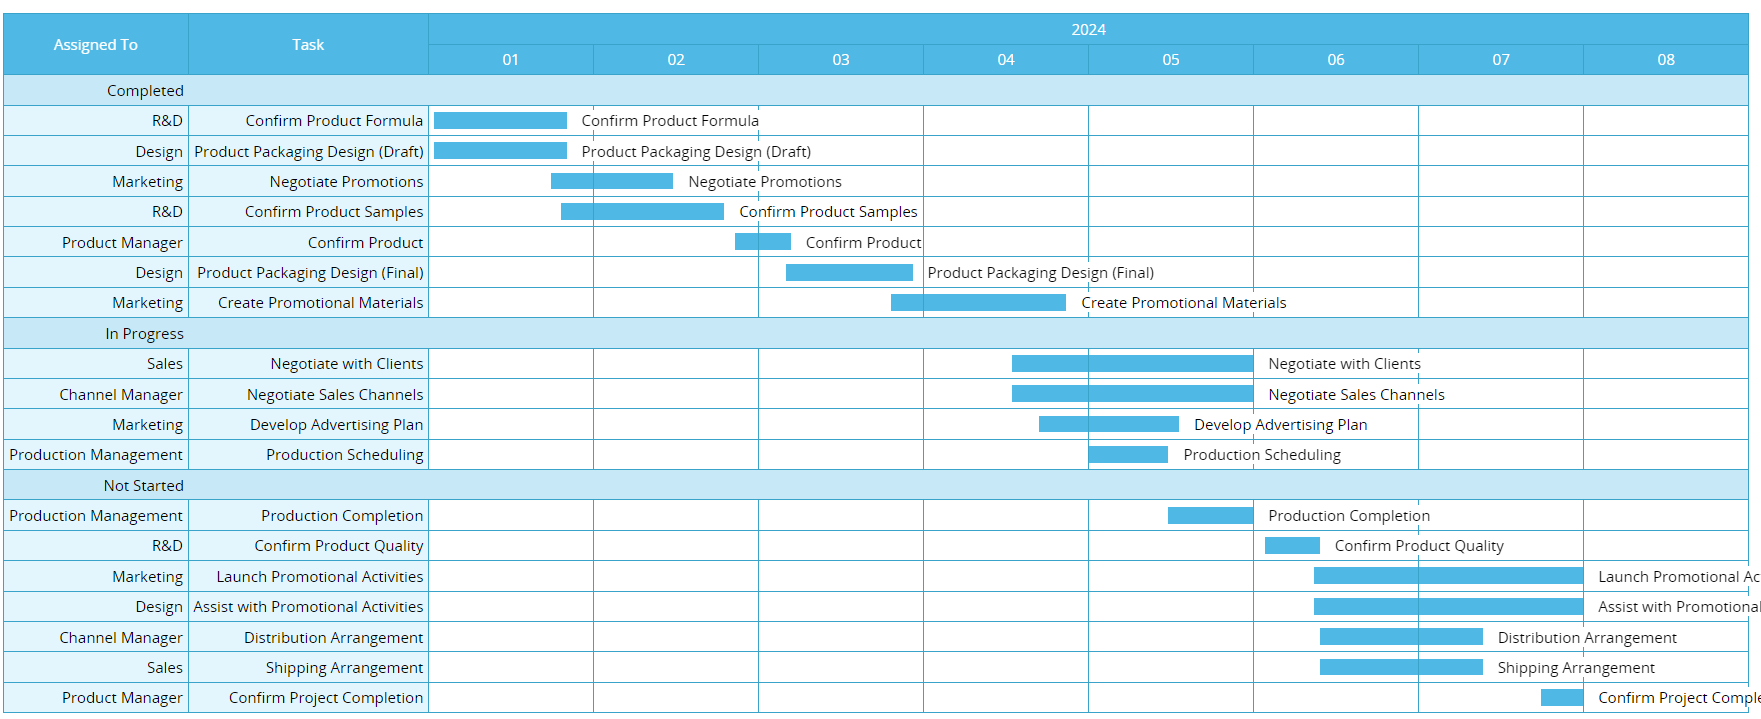
A Gantt Chart is a common project management tool that helps visualize project timelines. It’s useful for tasks such as new product planning, event preparation, and marketing campaign scheduling. You can generate a Gantt Chart whenever your sheet includes the Start and End Date fields.
After creating the Gantt Chart report, the following page will appear. Adjust the settings in the upper left section based on your needs. After each adjustment, click Create Report to update the settings.
The settings for the Gantt Chart are explained below:
In the first row, select the Date fields from the sheet for the "Start Date" and "End Date".
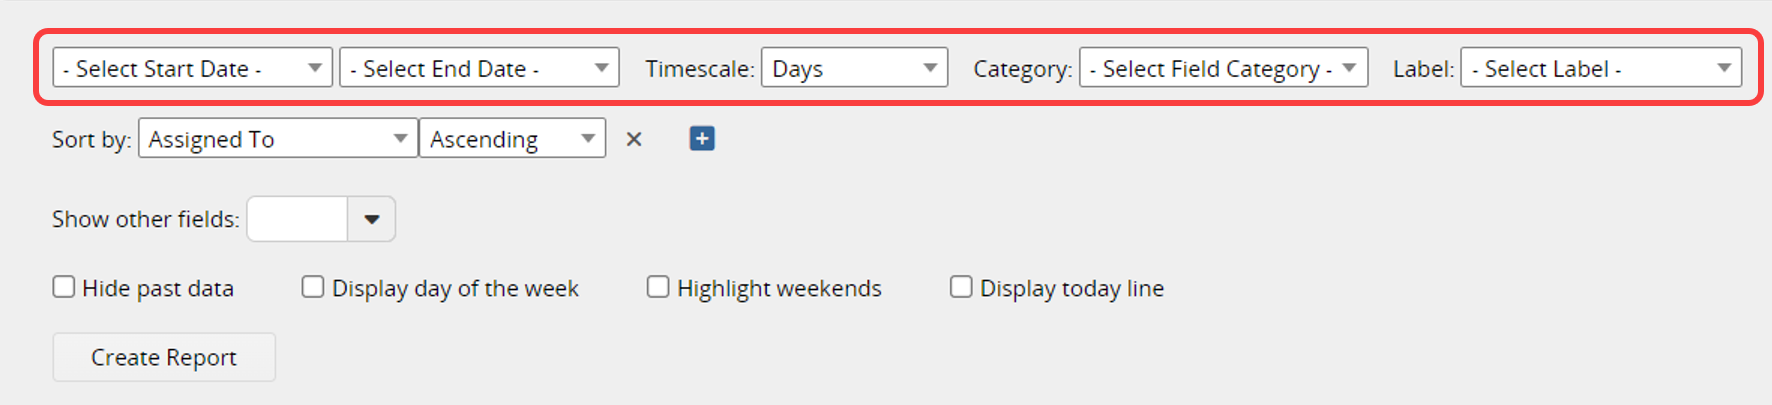
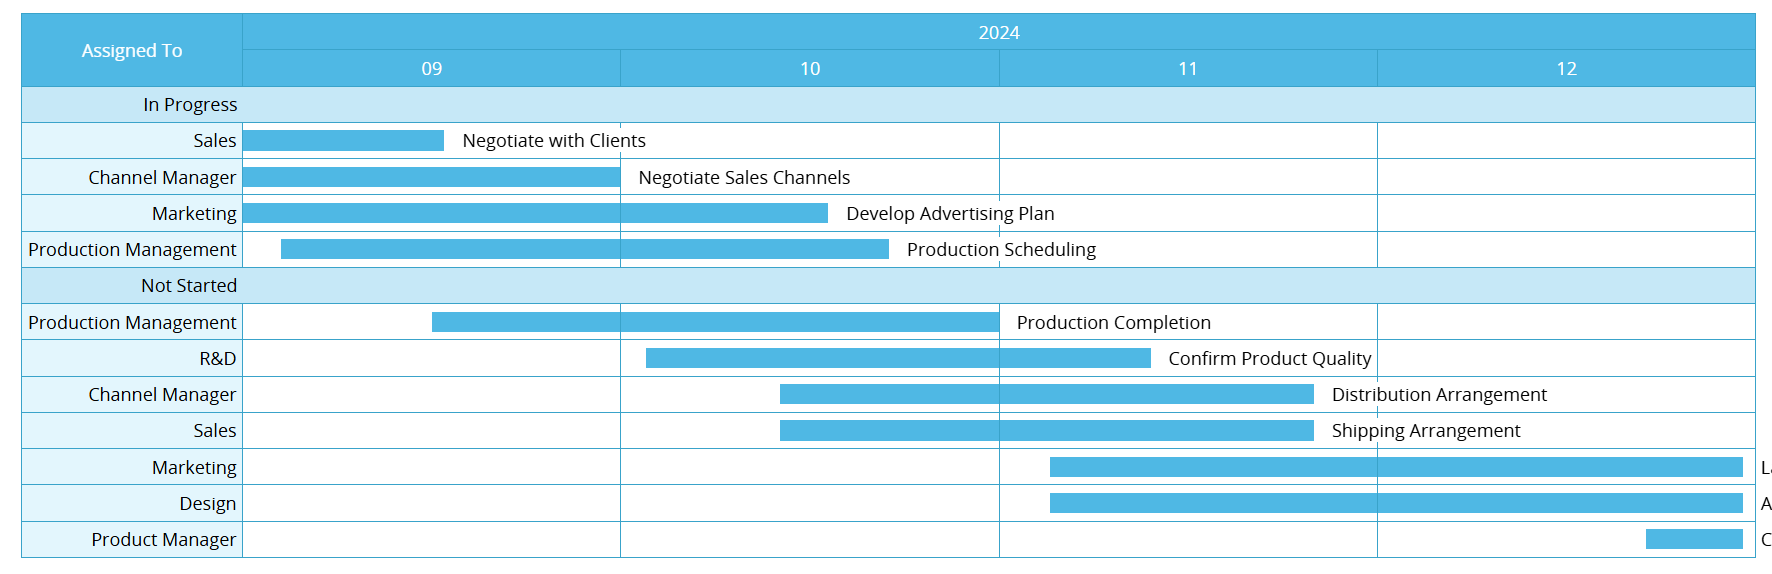
The Category setting allows you to choose which field from the sheet will be used to categorize the Gantt Chart. Available Field Types include Free Text, Selection (such as Selection, Select User, Checkbox, etc.), and Date fields. Other Field Types and Subtable fields cannot be selected. For example, you can categorize the Gantt chart by "Assigned To" or "Status" in the "Project" sheet.
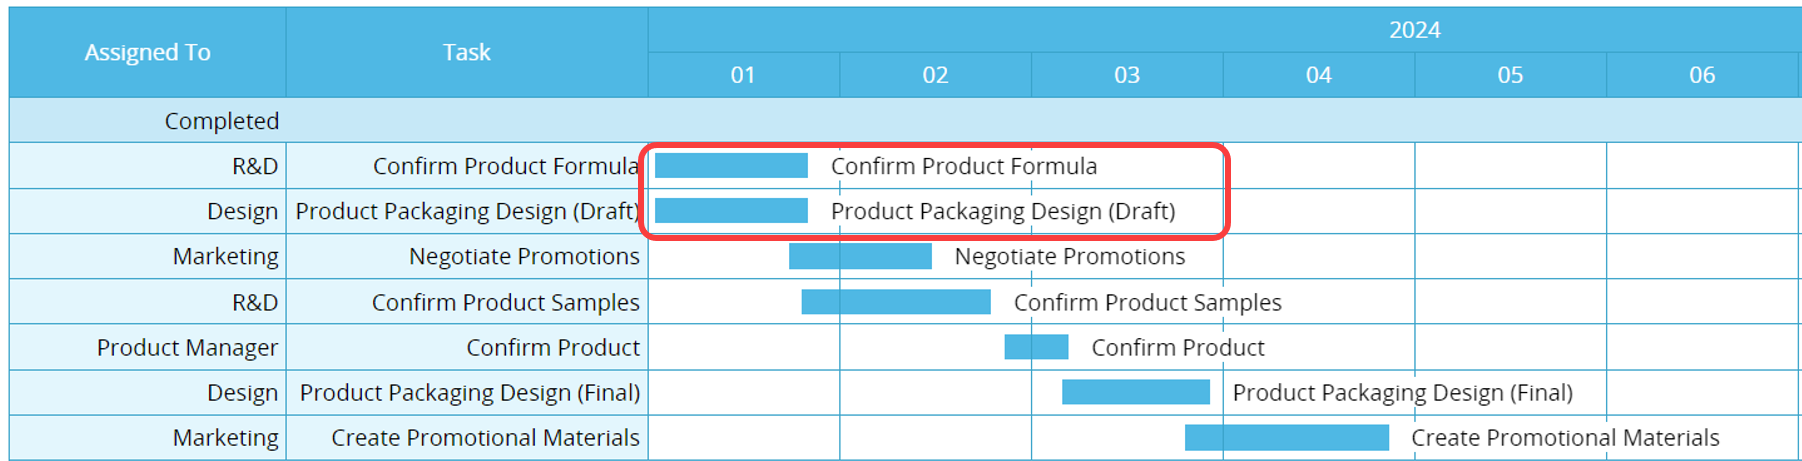
The Label setting allows you to select which field's content will be displayed as a label on each record in the Gantt Chart.
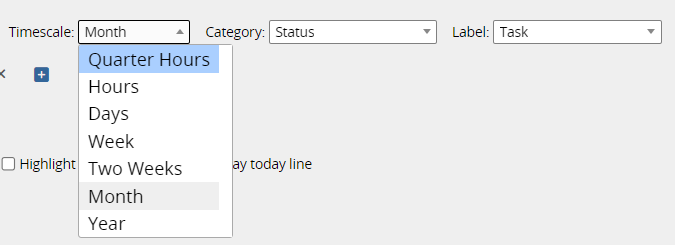
In the first row, you can also set the Timescale, choosing to display the report by Year, Month, Week, Days, Hours, or Quarter Hours.
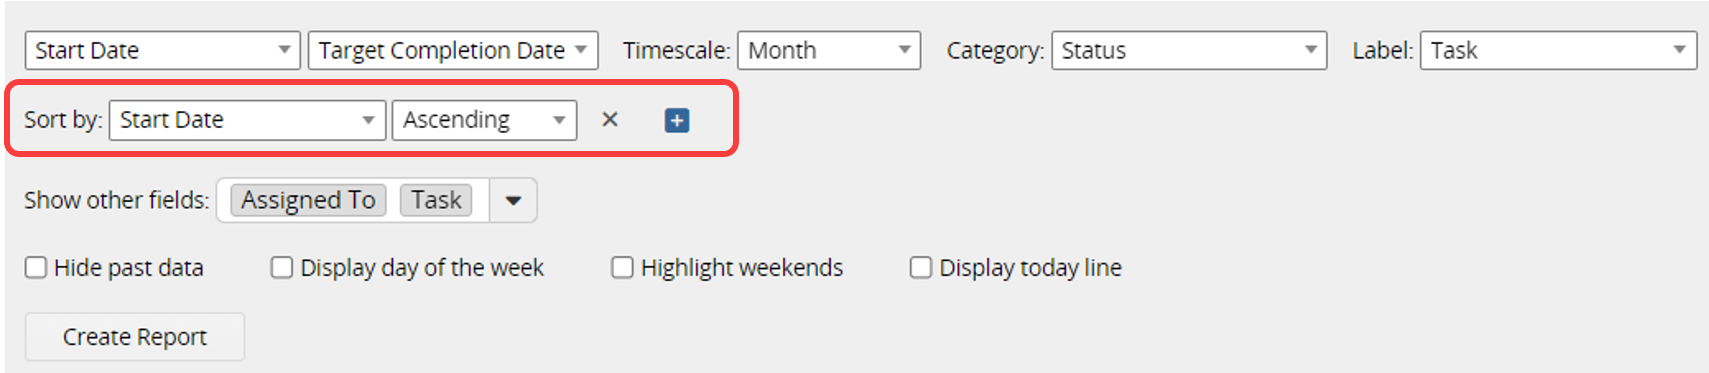
In the second row, choose the field in Sort by to determine how the data will be sorted, and specify whether the order should be ascending or descending. For example, you can sort projects by "Start Date" in ascending order. Click the + next to it to add a second sort field.
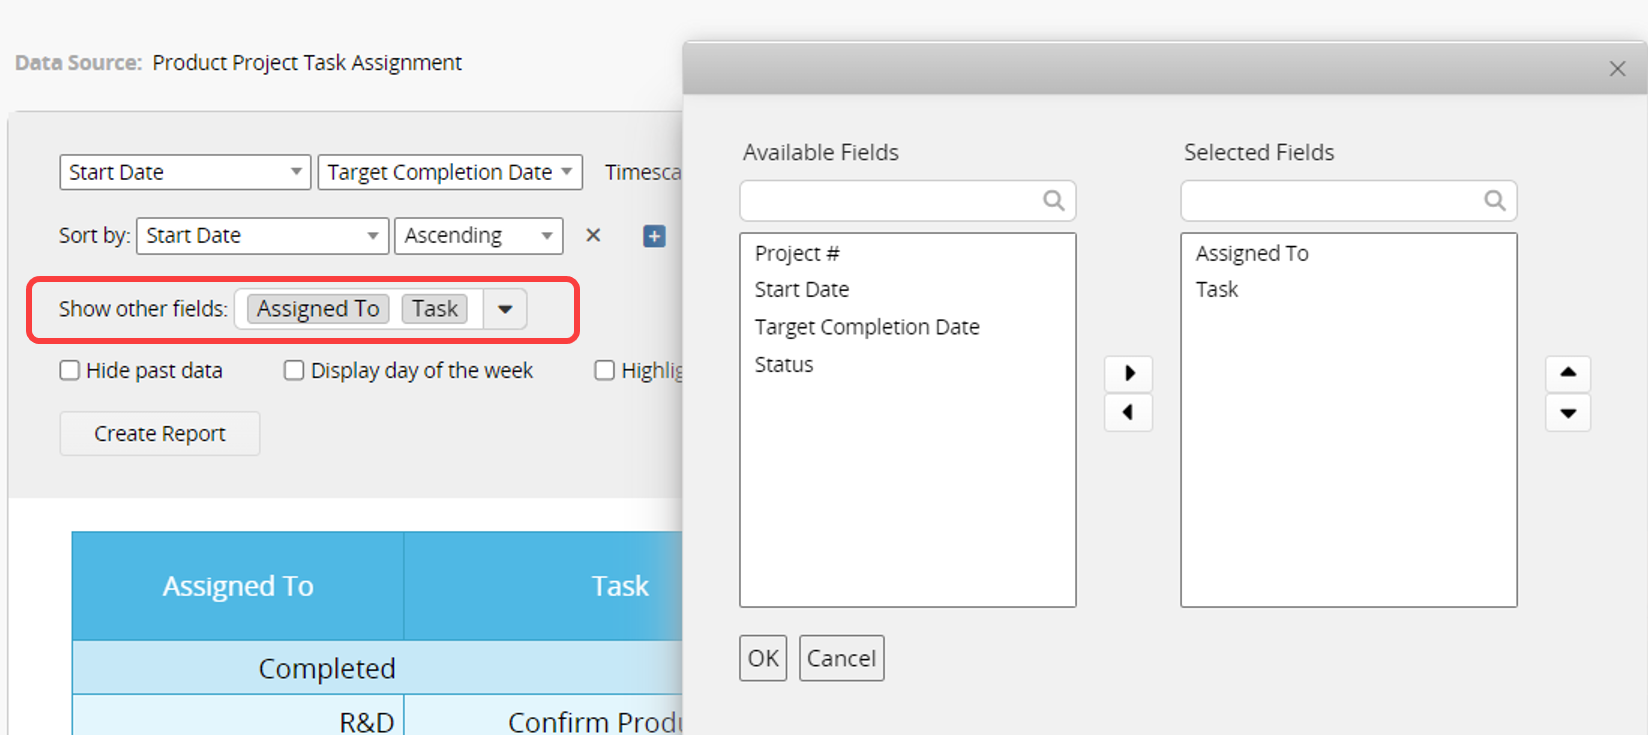
In the third row, Show other fields allows you to add fields to the Gantt Chart and determine their display order.
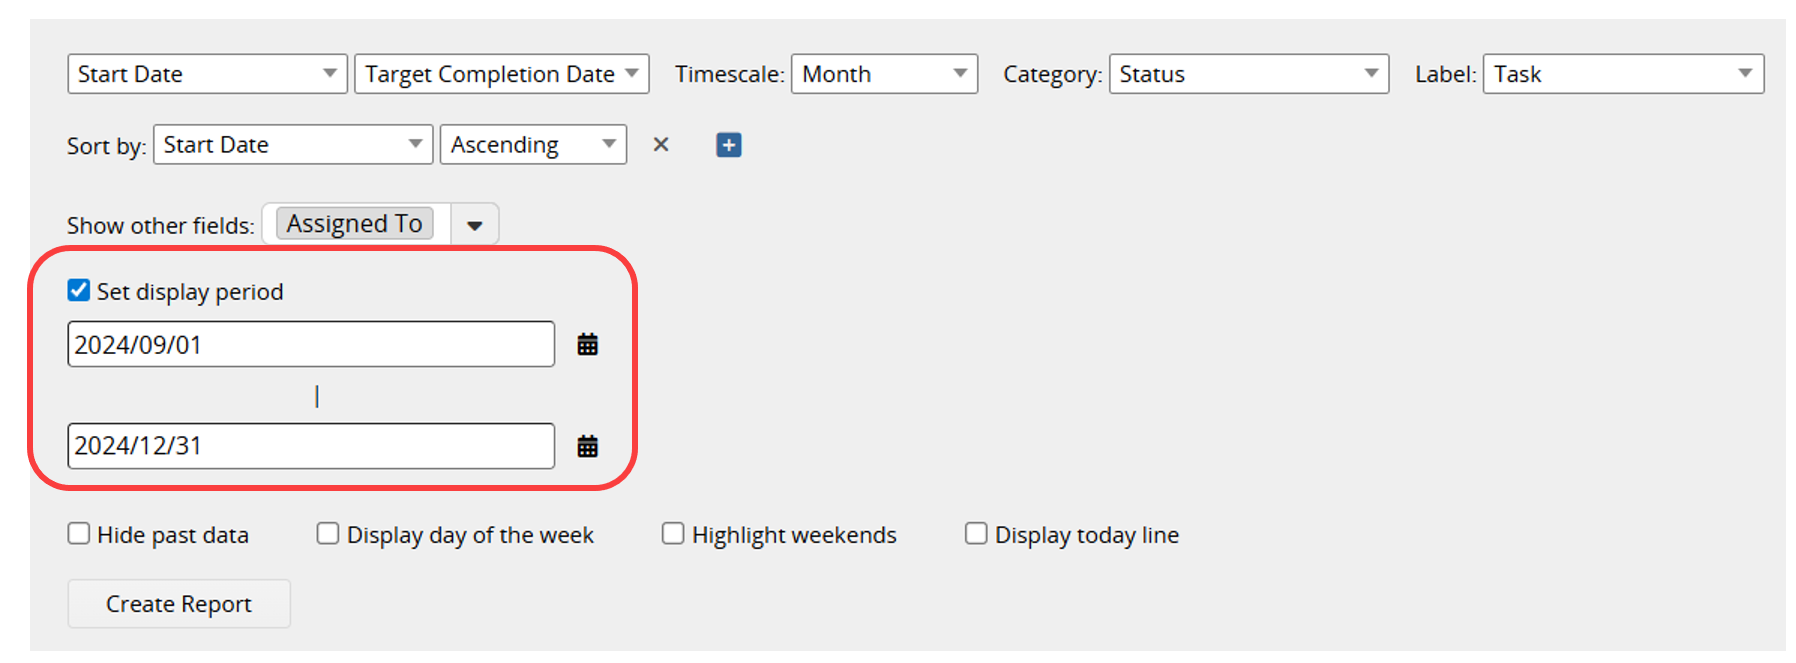
After checking "Set display period", you can set a date range to display only the items within that period.
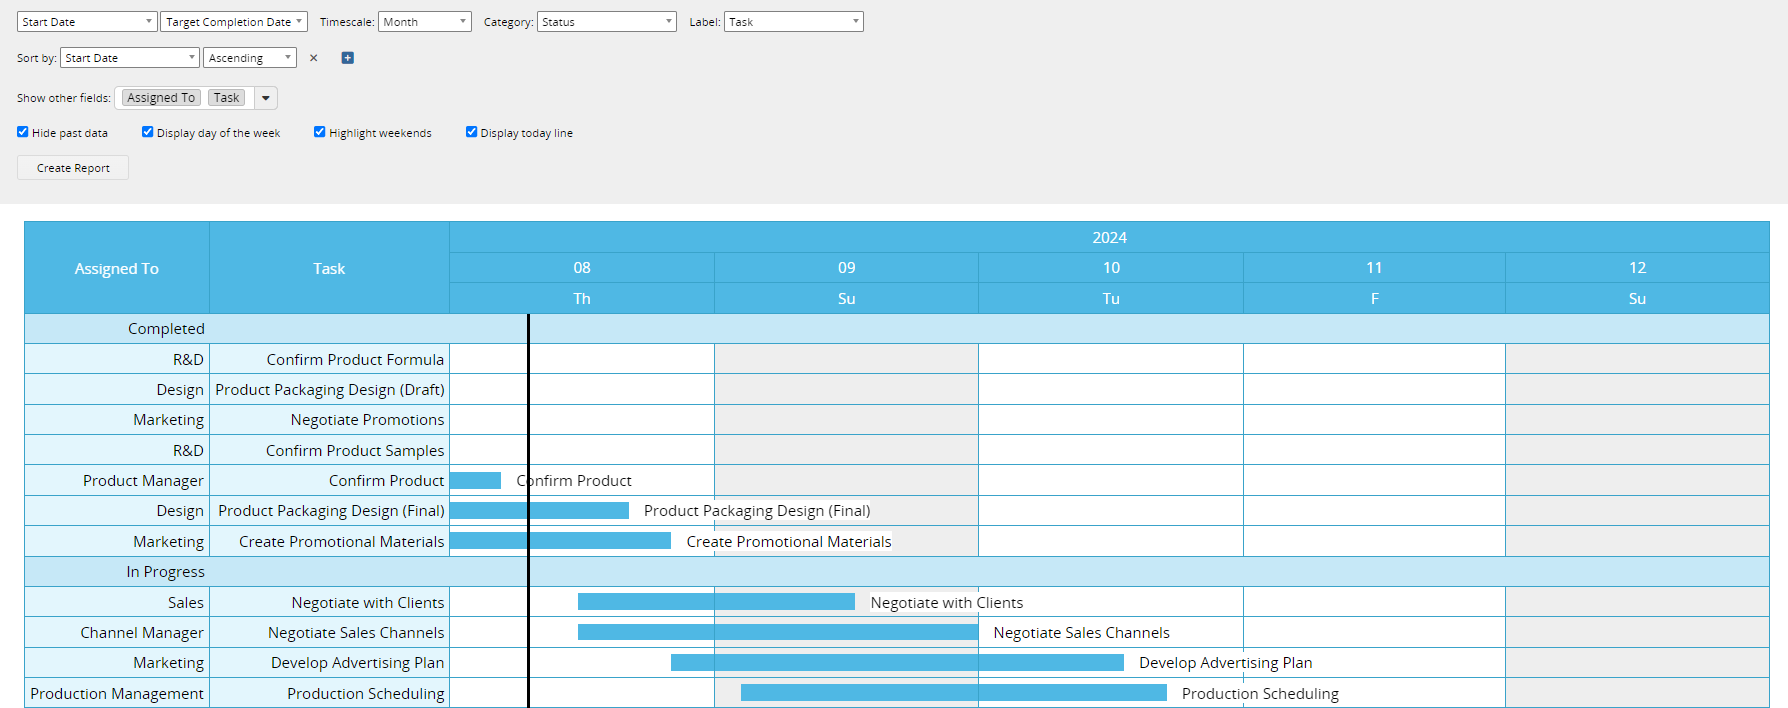
In the fourth row, you can select additional display settings.
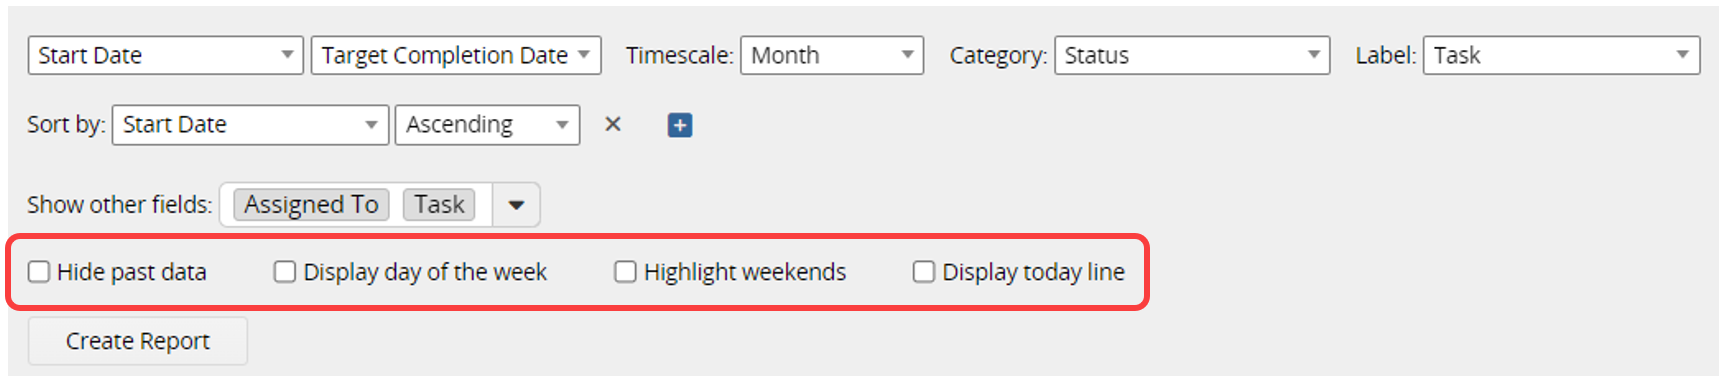
1. Hide past data: Display only dates from today onward.
2. Display day of the week: Add a row below the date to show the day of the week; applicable only for timescales set to Day, Hour, or Quarter Hour.
3. Highlight weekends: Weekends will be highlighted in color for easier viewing.
4. Display today line: A black line will be marked on today’s date.
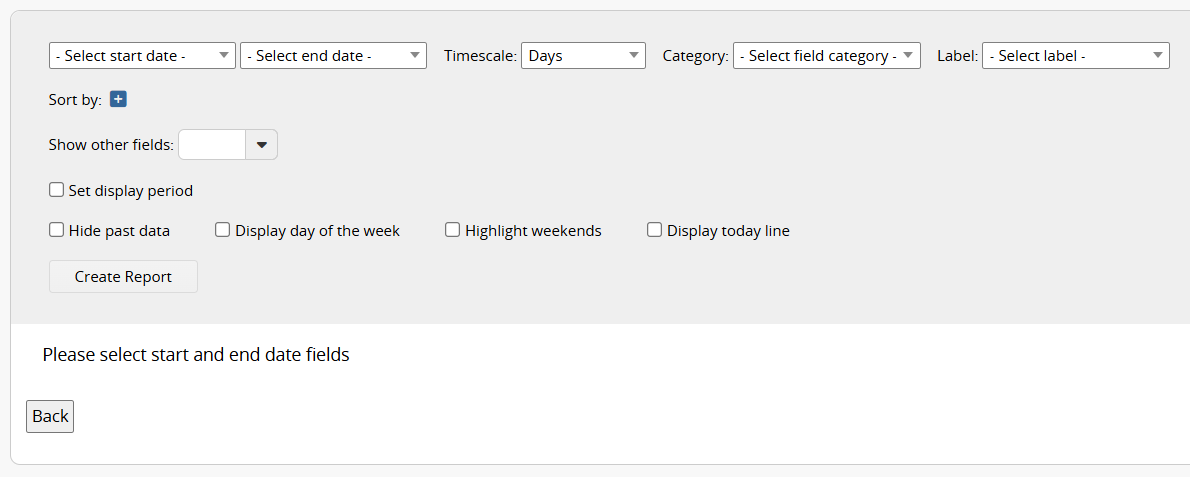
If there are no Date fields in the sheet, a warning message will appear when creating the report.
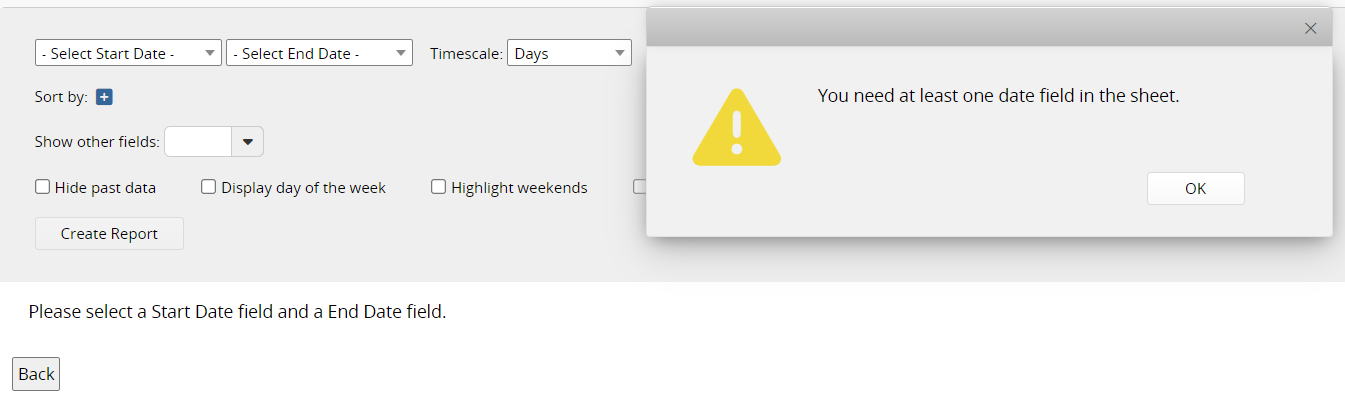
Additionally, since fields in Subtables cannot be included in the report, if you need to analyze Subtable data, consider creating a new sheet from the Subtable.
If you frequently use this type of report, you can save it for easy access later. Additionally, you can export the report as a PDF file or print it.
You can apply filters to generate the desired report.
You can embed the report into your website or share a link with others.
In the Report Settings, you can adjust the report’s style settings, including font, font size, borders, etc., and the report’s Filter and Access Rights.
 Thank you for your valuable feedback!
